以前の記事にて外れ値の検定として下記三つを挙げました
・Grubbs' Test
・Tietjen-Moore Test
・Generalized Extreme Studentized Deviate (ESD) Test
今回、外れ値の検定としてグラブス検定(Grubbs' Test)と一般化ESD検定(Generalized ESD Test)を試してみようと思います。
Grubb's TestもGeneralized ESD Testもおおよそ正規分布(approximately normal distribution)であることを仮定しているので、まずは正規分布であることを確認しようと思います。
it is recommended that you generate a normal probability plot of the data before applying an outlier test. Although you can also perform formal tests for normality, the presence of one or more outliers may cause the tests to reject normality when it is in fact a reasonable assumption for applying the outlier test. 引用: https://www.itl.nist.gov/div898/handbook/eda/section3/eda35h.htm#Normality
正規分布かどうかを確認するためには、正規確率プロット※1(normal probability plot)を描いて確認すると良いようです。
(正規確率プロットが直線に沿っていれば正規分布に従っていることを示唆するようです。)
Kolmogorov-Smirnov test や Shapiro-Wilk testで正規性を検証することもできますが、外れ値が存在する場合は意図せずに帰無仮説(H0=分布が正規分布である)が棄却されてしまう可能性があるようです。
If your data follow an approximately lognormal distribution, you can transform the data to normality by taking the logarithms of the data and then applying the outlier tests. 引用: https://www.itl.nist.gov/div898/handbook/eda/section3/eda35h.htm#Lognormal
なお、もしデータが対数正規分布(lognormal distribution)に従っている場合は、対数を取り正規分布に変換後に外れ値検定をすると良いようです。
Grubb's testをやってみる
関数宣言
# TODO:本当はオプションで片側検定か両側検定で分けたい
# Grubb's test (two sided)
#H0:There are no outliers in the data set
#Ha:There is exactly one outlier in the data set
def grubbs_test_twosided(Y):
    import numpy as np
    import scipy.stats as stats

    # Significance level
    alpha = 0.05

    # Calculate G
    Ymean = np.mean(Y)
    s = np.std(Y, ddof=1) # use sample std
    G_calculated = max(abs(Y - Ymean)) / s

    #  critical value of the t distribution with N-2 degrees of freedom and a significance level of α/(2N).
    N = len(Y)
    t = stats.t.ppf(1 - (alpha / (2 * N)), N - 2)
    G_critical = (N - 1) / np.sqrt(N) * np.sqrt(np.square(t) / ((N - 2) + np.square(t)))

    print("G_calculated = ", G_calculated)
    print("G_critical = ", G_critical)

    if G_calculated > G_critical:
        print("G_calculated > G_criticalなので帰無仮説は棄却され外れ値は存在する")
    else:
        print("G_calculated < G_criticalなので帰無仮説は棄却されず外れ値は存在するとは言えない")
# Grubb's test (max one sided)
#H0: there are no outliers in the data
#Ha: the maximum value is an outlier
def grubbs_test_onesided_max(Y):
import numpy as np
import scipy.stats as stats
# Significance level
alpha = 0.05
# Calculate G
Ymean = np.mean(Y)
s = np.std(Y, ddof=1) # use sample std
max_val = np.max(Y)
G_calculated = (max_val - Ymean) / s
# critical value of the t distribution with N-2 degrees of freedom and a significance level of α/(N).
N = len(Y)
t = stats.t.ppf(1 - (alpha / N), N - 2)
G_critical = (N - 1) / np.sqrt(N) * np.sqrt(np.square(t) / ((N - 2) + np.square(t)))
print("max_val = ", max_val)
print("G_calculated = ", G_calculated)
print("G_critical = ", G_critical)
if G_calculated > G_critical:
print("G_calculated > G_criticalなので帰無仮説は棄却され", max_val ,"は外れ値である")
else:
print("G_calculated < G_criticalなので帰無仮説は棄却されず", max_val ,"は外れ値であるとは言えない")サンプルデータの読み込み
# Grubb's testのサンプルデータ
# https://www.itl.nist.gov/div898/handbook/eda/section3/eda35h1.htm
import numpy as np
import scipy.stats as stats

Y = np.array([199.31,199.53,200.19,200.82,201.92,201.95,202.18,245.57])
正規分布に従うかどうかをQQプロットを描画して確認
# 描画設定
import seaborn as sns
import matplotlib.pyplot as plt
sns.set_style("whitegrid")
from matplotlib import rcParams
rcParams['font.family'] = 'Hiragino Sans' # Macの場合
#rcParams['font.family'] = 'Meiryo' # Windowsの場合
#rcParams['font.family'] = 'VL PGothic' # Linuxの場合
rcParams['xtick.labelsize'] = 12       # x軸のラベルのフォントサイズ
rcParams['ytick.labelsize'] = 12       # y軸のラベルのフォントサイズ
rcParams['axes.labelsize'] = 18        # ラベルのフォントとサイズ
rcParams['figure.figsize'] = 18,8      # 画像サイズの変更(inch)
# 正規分布に従うかどうかをQQプロットを描画して確認
stats.probplot(Y, dist="norm", plot=plt)
plt.show()
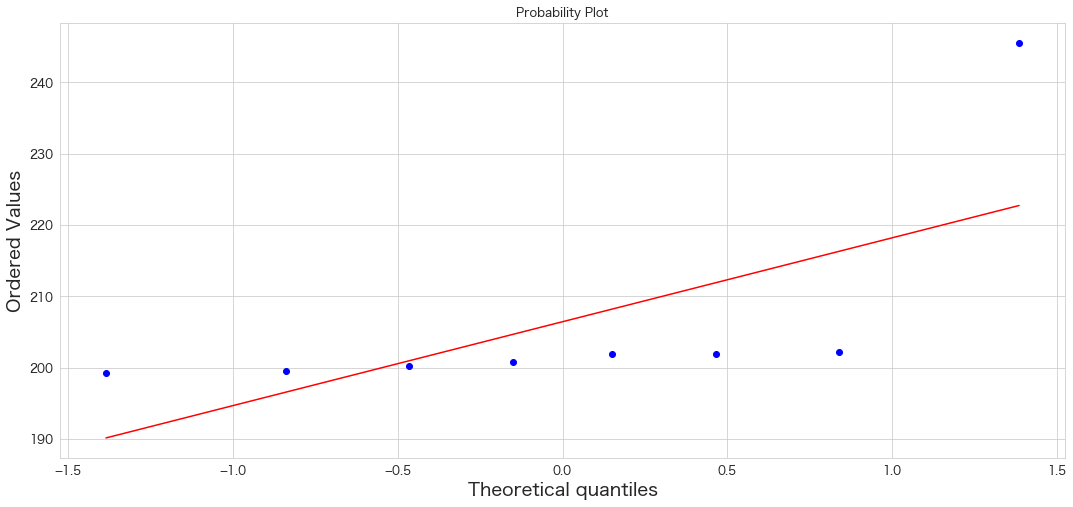
NISTのテストデータなのに正規分布に従ってなさそうですね 笑
しかし1プロットだけ明らかに外れ値のようです。
この外れ値をさっそく、grubb's testで検定してみましょう。
# 両側検定
grubbs_test_twosided(Y)G_calculated = 2.46876461121245 G_critical = 2.1266450871956257 G_calculated > G_criticalなので帰無仮説は棄却され外れ値は存在する
# 片側検定 (最大値)
grubbs_test_onesided_max(Y)max_val = 245.57 G_calculated = 2.46876461121245 G_critical = 2.031652001549952 G_calculated > G_criticalなので帰無仮説は棄却され 245.57 は外れ値である
245.57は外れ値であるという結果になりました。
generalized extreme Studentized deviate (ESD) test をやってみる
次にgeneralized ESD testをやってみます。
こちらのテストの方が汎用的で使い道が多くありそうです。
まず、NISTで用意されているgeneralized ESD test用のデータを読み込みます。
サンプルデータの読み込み
import pandas as pd
# separatorがデフォルト(,)だと下記エラーになったので、¥tに変更した。
# EmptyDataError: No columns to parse from file
df = pd.read_csv("https://www.itl.nist.gov/div898/handbook/datasets/ROSNER.DAT",header=None,sep="\t",skiprows=21,verbose=1,names=["col1"])
    Tokenization took: 0.02 ms
    Type conversion took: 0.25 ms
    Parser memory cleanup took: 0.01 ms
サンプルデータの統計情報を確認
df.info()RangeIndex: 54 entries, 0 to 53 Data columns (total 1 columns): # Column Non-Null Count Dtype --- ------ -------------- ----- 0 col1 54 non-null float64 dtypes: float64(1) memory usage: 560.0 bytes
df.describe()
col1 count 54.000000 mean 2.320741 std 1.182870 min -0.250000 25% 1.565000 50% 2.095000 75% 2.835000 max 6.010000
QQプロットの確認
# 正規分布に従うかどうかをQQプロットを描画して確認
stats.probplot(df["col1"], dist="norm", plot=plt)
plt.show()
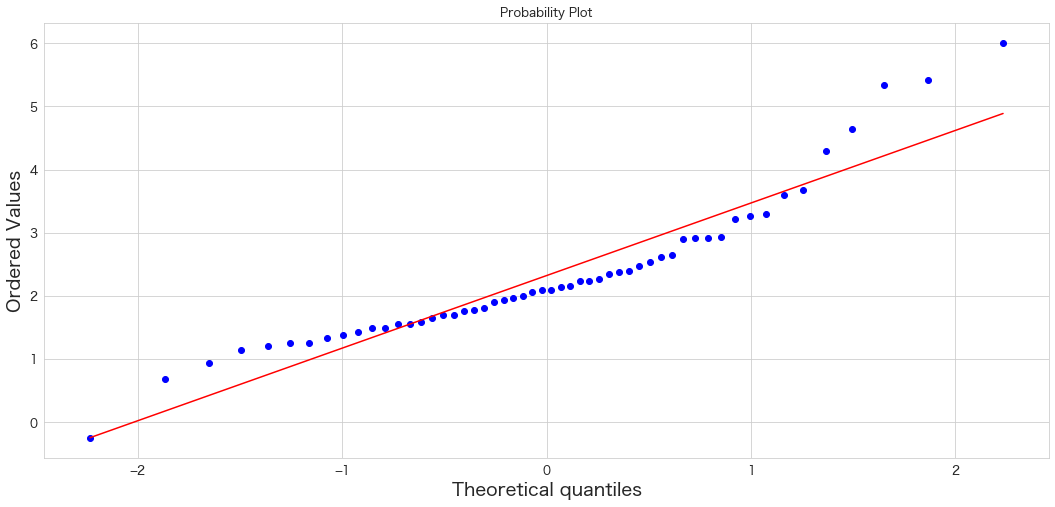
こちらもあんまり正規分布とは言い難い結果かもしれませんがサンプルテストなので気にせず利用します 笑
せっかくgrubb's testを実装したので、確認してみます。
サンプルデータでgrubb's testを確認してみる
# 両側検定
grubbs_test_twosided(df["col1"])G_calculated = 3.1189060489824416 G_critical = 3.1587939408872967 G_calculated < G_criticalなので帰無仮説は棄却されず外れ値は存在するとは言えない
# 片側検定 (最大値)
grubbs_test_onesided_max(df["col1"])max_val = 6.01 G_calculated = 3.1189060489824416 G_critical = 2.9868080398667263 G_calculated > G_criticalなので帰無仮説は棄却され 6.01 は外れ値である
両側検定では外れ値があるとは言えませんでしたが、片側検定だと外れ値だという結果になりました。
generalized ESD testの関数
Generalized ESD testの関数です。引数にnumpyデータの投入を想定しています。
ほぼNISTのサイトで紹介されている数式の通りに実装することによって勉強するときにも理解しやすいようになったかなと思います。
# Generalized ESD test (https://www.itl.nist.gov/div898/handbook/eda/section3/eda35h3.htm)
#H0: There are no outliers in the data set
#Ha: There are up to r outliers in the data set
# arguments Y:numpy.ndarray、r:iteration num
def generalized_esd_test(Y,r):
    import numpy as np
    import scipy.stats as stats

    # deepcopyしておく
    from copy import deepcopy
    X = deepcopy(Y)

    # maximum iteration num
    r = r

    # Significance level
    alpha = 0.05

    # sample size
    N = len(X)

    # Calculate G
    for i in range(1, r + 1):
        print("i = ",i)

        Xmean = np.mean(X)
        s = np.std(X, ddof=1) # use sample std
        max_diviation = max(abs(X - Xmean))
        max_diviation_idx = np.argmax(abs(X - Xmean))
        possible_outlier = Y[max_diviation_idx]

        # G calculatedを計算
        G_calculated = max_diviation / s

        print("possible_outlier = ",possible_outlier,"(idx = ",str(max_diviation_idx) + ")")

        #  critical value of the t distribution with N-i-1 degrees of freedom and a significance level of α/2(N-i+1).
        t = stats.t.ppf(1 - (alpha / (2 * (N - i + 1))), N - i - 1)

        print("N=",N - i + 1)
        print("t=",t,"degree of freedom=",N - i - 1)

        # G criticalを計算
        G_critical = (N - i) * t / np.sqrt((N - i - 1 + np.square(t)) * (N - i + 1))

        print("G_calculated = ", G_calculated)
        print("G_critical = ", G_critical)

        if G_calculated > G_critical:
            print("G_calculated > G_criticalなので帰無仮説は棄却され外れ値は存在する")
        else:
            print("G_calculated < G_criticalなので帰無仮説は棄却されず外れ値は存在するとは言えない")

        # 外れ値と思われる値を削除し再度検定をする
        X = np.delete(X,max_diviation_idx,0)
        print("\n")
r=5でサンプルテストに対してgeneralized ESD testを実施してみます。
generalized ESD testの実施
generalized_esd_test(df["col1"].values,5)i = 1 possible_outlier = 6.01 (idx = 53) N= 54 t= 3.5130863811666533 degree of freedom= 52 G_calculated = 3.1189060489824416 G_critical = 3.1587939408872967 G_calculated < G_criticalなので帰無仮説は棄却されず外れ値は存在するとは言えない i = 2 possible_outlier = 5.42 (idx = 52) N= 53 t= 3.5110632638854025 degree of freedom= 51 G_calculated = 2.9429731136435064 G_critical = 3.1514300233157844 G_calculated < G_criticalなので帰無仮説は棄却されず外れ値は存在するとは言えない i = 3 possible_outlier = 5.34 (idx = 51) N= 52 t= 3.509050738830828 degree of freedom= 50 G_calculated = 3.179423936717836 G_critical = 3.14388968503173 G_calculated > G_criticalなので帰無仮説は棄却され外れ値は存在する i = 4 possible_outlier = 4.64 (idx = 50) N= 51 t= 3.5070513584223146 degree of freedom= 49 G_calculated = 2.81018114442759 G_critical = 3.1361649560574856 G_calculated < G_criticalなので帰無仮説は棄却されず外れ値は存在するとは言えない i = 5 possible_outlier = -0.25 (idx = 0) N= 50 t= 3.505067970469734 degree of freedom= 48 G_calculated = 2.8155795634442775 G_critical = 3.1282473343306387 G_calculated < G_criticalなので帰無仮説は棄却されず外れ値は存在するとは言えない
i = 3のときに外れ値が存在するという結果が出たので、外れ値は3つあるようです。 (6.01、5.42、5.34)
もし下記のような結果になる場合は、帰無仮説が棄却されるiの最大値の数だけ外れ値があるという解釈になるようです。(この場合、外れ値は4つある)
・i = 1で帰無仮説が棄却
・i = 2で帰無仮説が棄却されない
・i = 3で帰無仮説が棄却されない
・i = 4で帰無仮説が棄却 *
正規分布でQQプロットを確認と正規性テストの実施
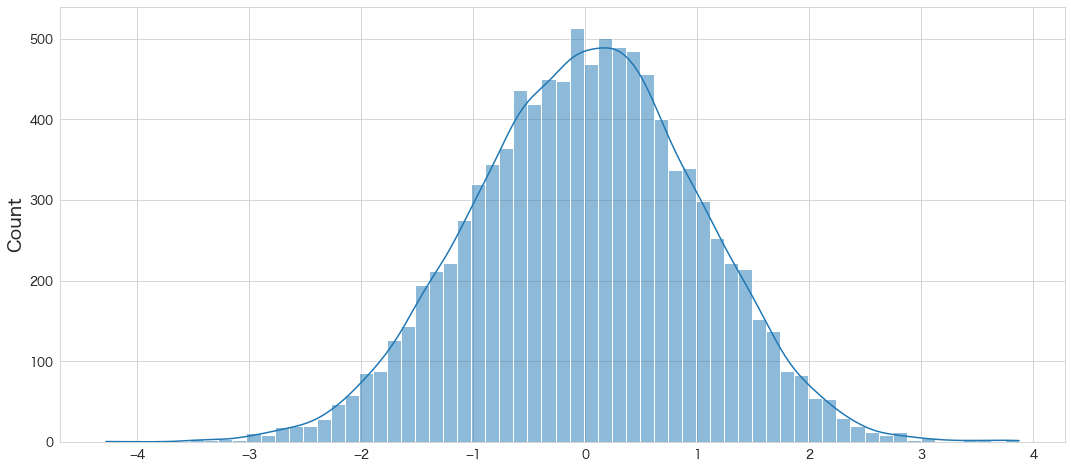
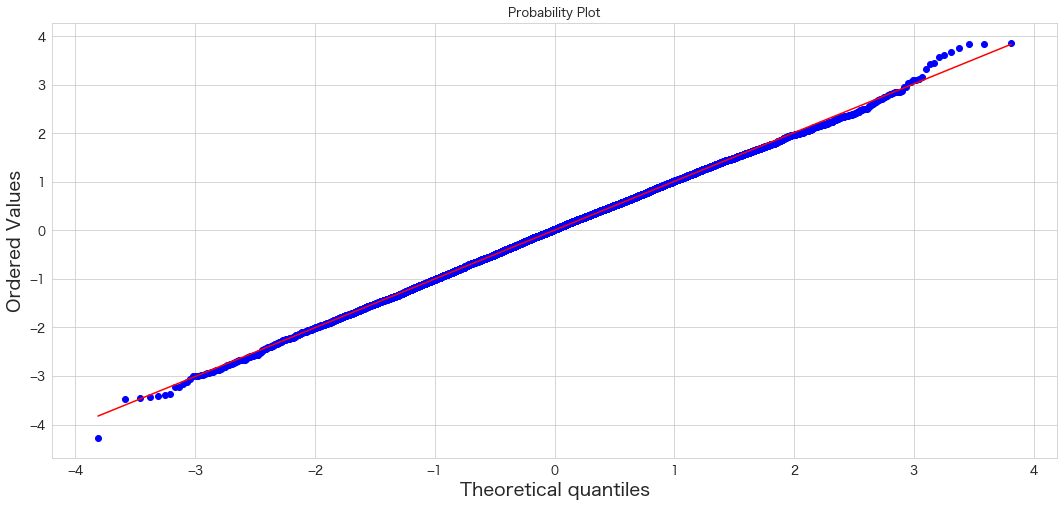
正規分布の場合のQQプロットがどういう見た目になるのか確認しておこうと思います。
また、正規分布ということがわかっているので、Kolmogorov–Smirnov test と Shapiro–Wilk testを使って正規性のテストもやっておこうと思います。
# 正規分布の作成
x = np.random.normal(
    loc   = 0,      # mean
    scale = 1,      # standard deviation
    size  = 10000   # sample
)
seedの設定をしていないのでグラフ描画結果などは変わると思います。
# 分布確認
sns.histplot(x, kde=True)
QQプロットを確認
# QQプロット確認
import scipy.stats as stats
stats.probplot(x, dist="norm", plot=plt)
plt.show()
綺麗に直線ですね。(前半と後半部分のプロットが若干怪しいですが 笑)
Kolmogorov–Smirnov testを実施
# 正規分布かどうかのテスト

# Kolmogorov–Smirnov test
# H0=分布が正規分布である
from scipy import stats
stats.kstest(x,"norm")KstestResult(statistic=0.01212042823894488, pvalue=0.1050620127183235)
pvalue > 0.05なのでH0は棄却されず、正規分布でないとは言えないという結果になりました。想定通りです。
KShapiro–Wilk testを実施
# Shapiro–Wilk test
# H0=分布が正規分布である
stats.shapiro(x)
/Users/hinomaruc/Desktop/notebooks/my-venv/lib/python3.9/site-packages/scipy/stats/_morestats.py:1761: UserWarning: p-value may not be accurate for N > 5000.
  warnings.warn("p-value may not be accurate for N > 5000.")

ShapiroResult(statistic=0.9995747804641724, pvalue=0.022312937304377556)
warningが出てしまいました。5000件より多いデータではShapiro-Wilk testはやらないようがいいようです。
参考
※1 QQプロットとも呼ぶようです。
・https://bellcurve.jp/statistics/blog/15362.html
・https://blog.goo.ne.jp/kosa_in_goo/e/795f8a9e62973a172060876a8700ed60
・https://www.kaggle.com/code/gadaadhaarigeek/q-q-plot/notebook
・https://github.com/arundo/adtk
・https://www.real-statistics.com/students-t-distribution/identifying-outliers-using-t-distribution/generalized-extreme-studentized-deviate-test/
